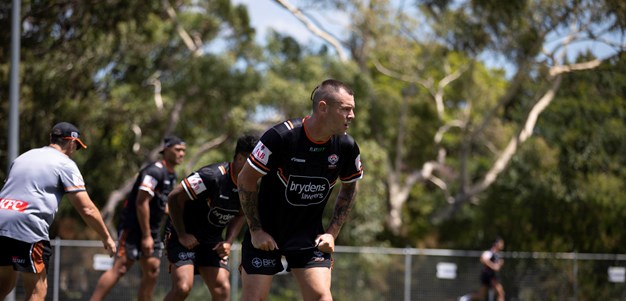

David Klemmer
Prop
Player Bio
- Height:
- 198 cm
- Date of Birth:
- 22 December 1993
- Weight:
- 109 kg
- Birthplace:
- Sydney, NSW
- Age:
- 31
- Nickname:
- Klem
- Debut Club:
- Canterbury-Bankstown Bulldogs
- Date:
- 09 March 2013
- Opposition:
- North Queensland Cowboys
- Round:
- 1
- Previous Clubs:
- Canterbury-Bankstown Bulldogs, Newcastle Knights
- Junior Club:
- All Saints Toongabbie
- Biography:
David joined Wests Tigers on a long-term deal ahead of the 2023 season after four years with Newcastle Knights.
The veteran prop made his NRL debut with Canterbury-Bankstown Bulldogs in 2013, playing his 200th game in his first season at Wests Tigers, against Parramatta Eels in Round 6.
Klemmer has played 19 tests for Australia, 14 Origin games for New South Wales, and remains one of the fittest front-rowers in the game.
David is signed to Wests Tigers until the end of the 2025 season, with a Mutual Option for the 2026 season.
Career
- Appearances
- 238
- Tries
- 6
Career By Season
| Year | Played | Won | Lost | Drawn | Win % | Tries | Goals | 1 Point Field Goals | 2 Point Field Goals | Points | Kicking Metres | Kicking Metres Average | Tackle Breaks | Post Contact Metres | Offloads | Tackles Made | Missed Tackles | Tackle Efficiency | Total Running Metres | Average Running Metres | Kick Return Metres | Total Points | Average Points | |
|---|---|---|---|---|---|---|---|---|---|---|---|---|---|---|---|---|---|---|---|---|---|---|---|---|
| Bulldogs | 2013 | 4 | 1 | 3 | - | 25% | - | - | - | - | - | - | - | - | 144 | 2 | 58 | 3 | 94.15% | 290 | 72.00 | 34 | 88 | 22.0 |
| Bulldogs | 2014 | 23 | 13 | 10 | - | 57% | 1 | - | - | - | 4 | - | - | 28 | 823 | 8 | 255 | 9 | 95.46% | 1,950 | 84.00 | 238 | 364 | 15.8 |
| Bulldogs | 2015 | 21 | 13 | 8 | - | 62% | 1 | - | - | - | 4 | - | - | 32 | 1,415 | 9 | 469 | 20 | 95.91% | 3,082 | 146.00 | 360 | 823 | 39.2 |
| Bulldogs | 2016 | 22 | 12 | 10 | - | 55% | 1 | - | - | - | 4 | - | - | 39 | 1,470 | 14 | 568 | 19 | 93.53% | 3,637 | 165.00 | 392 | 990 | 45.0 |
| Bulldogs | 2017 | 21 | 8 | 13 | - | 38% | 1 | - | - | - | 4 | 12 | 0.56 | 40 | 1,517 | 13 | 521 | 28 | 94.90% | 3,509 | 167.00 | 371 | 912 | 43.4 |
| Bulldogs | 2018 | 22 | 7 | 15 | - | 32% | - | - | - | - | - | 32 | 1.48 | 38 | 1,653 | 24 | 542 | 32 | 94.43% | 3,982 | 181.00 | 472 | 977 | 44.4 |
| Knights | 2019 | 21 | 9 | 12 | - | 43% | - | - | - | - | - | 22 | 1.03 | 26 | 1,323 | 23 | 719 | 13 | 98.22% | 3,560 | 169.00 | 398 | 1,139 | 54.2 |
| Knights | 2020 | 21 | 11 | 9 | 1 | 52% | - | - | - | - | - | 9 | 0.44 | 21 | 1,531 | 45 | 712 | 20 | 97.27% | 3,626 | 172.00 | 275 | 1,132 | 53.9 |
| Knights | 2021 | 21 | 11 | 10 | - | 52% | - | - | - | - | - | - | - | 16 | 1,401 | 17 | 603 | 15 | 97.57% | 3,454 | 164.00 | 225 | 961 | 45.8 |
| Knights | 2022 | 18 | 4 | 14 | - | 22% | 1 | - | - | - | 4 | 49 | 2.71 | 22 | 1,180 | 36 | 589 | 18 | 97.03% | 2,793 | 155.00 | 277 | 1,003 | 55.7 |
| Wests Tigers | 2023 | 24 | 4 | 20 | - | 17% | 1 | - | - | - | 4 | - | - | 23 | 1,293 | 21 | 610 | 7 | 98.87% | 3,347 | 139.00 | 405 | 1,041 | 43.4 |
| Wests Tigers | 2024 | 20 | 4 | 16 | - | 20% | - | - | - | - | - | 42 | 2.11 | 15 | 846 | 5 | 455 | 17 | 96.40% | 2,023 | 101.00 | 203 | 656 | 32.8 |
Career Overall
| Year Start | Year End | Played | Won | Lost | Drawn | Win % | Tries | Goals | 1 Point Field Goals | 2 Point Field Goals | Points | Kicking Metres | Kicking Metres Average | Tackle Breaks | Post Contact Metres | Offloads | Tackles Made | Missed Tackles | Tackle Efficiency | Total Running Metres | Average Running Metres | Kick Return Metres | Total Points | Average Points | |
|---|---|---|---|---|---|---|---|---|---|---|---|---|---|---|---|---|---|---|---|---|---|---|---|---|---|
| Bulldogs | 2013 | 2018 | 113 | 54 | 59 | - | 48% | 4 | - | - | - | 16 | 44 | 0.39 | 177 | 7,017 | 70 | 2,413 | 111 | 95.60% | 16,442 | 145.00 | 1,869 | 4,152 | 36.7 |
| Knights | 2019 | 2022 | 81 | 35 | 45 | 1 | 43% | 1 | - | - | - | 4 | 80 | 0.98 | 85 | 5,436 | 121 | 2,622 | 66 | 97.54% | 13,434 | 165.00 | 1,176 | 4,234 | 52.3 |
| Wests Tigers | 2023 | 2024 | 44 | 8 | 36 | - | 18% | 1 | - | - | - | 4 | 42 | 0.96 | 38 | 2,139 | 26 | 1,065 | 24 | 97.80% | 5,370 | 122.00 | 608 | 1,697 | 38.6 |
Latest
Team Mates

Wests Tigers respect and honour the Traditional Custodians of the land and pay our respects to their Elders past, present and future. We acknowledge the stories, traditions and living cultures of Aboriginal and Torres Strait Islander peoples on the lands we meet, gather and play on.


