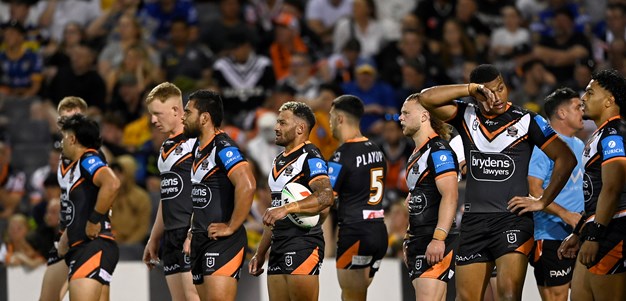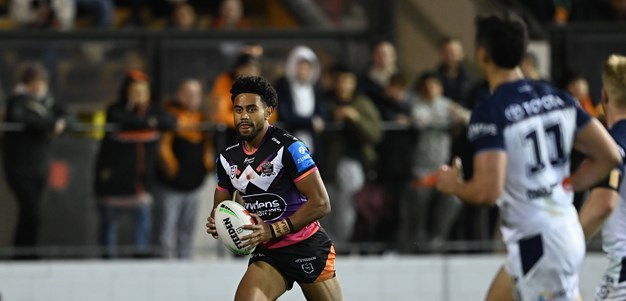

Apisai Koroisau
Captain - Hooker
Player Bio
- Height:
- 172 cm
- Date of Birth:
- 07 November 1992
- Weight:
- 87 kg
- Birthplace:
- Sydney, NSW
- Age:
- 32
- Nickname:
- Api
- Debut Club:
- South Sydney Rabbitohs
- Date:
- 30 March 2014
- Opposition:
- Canberra Raiders
- Round:
- 4
- Previous Clubs:
- South Sydney Rabbitohs, Penrith Panthers, Manly-Warringah Sea Eagles
- Junior Club:
- Berala Bears
- Biography:
Api joined Wests Tigers from the Panthers in 2023, and following an outstanding first season as team captain, extended his playing contract through until the end of 2026.
Koroisau debuted for South Sydney in 2014, playing in their drought-breaking premiership victory over the Bulldogs later that year.
He returned to the Panthers in 2020 after four seasons at the Sea Eagles and helped the club to its third successive grand final appearance.
A three-time premiership winner, Api played his fourth State of Origin match for NSW in game one of the 2023 series.
Career
- Appearances
- 218
- Tries
- 36
2025 Season
- Appearances
- 5
Scoring
- Tries
- 1
- Goals
- 5
Kicking
- Forced Drop Outs
- 0
- Average Kicking Metres
- 48.6
- Goal Conversion Rate
-
Attack
- Try Assists
- 1
- Line Break Assists
- 1
Passing
- Offloads
- 2
- Receipts
- 475
Defence
- Tackles Made
- 141
- Tackle Efficiency
-
Running Metres
- Average Running Metres
- 54
- Total Running Metres
- 271
Fantasy
- Total Points
- 197
- Average Points
- 39.4
2025 Season - By Round
| Round | Opponent | Score | Position | Minutes Played | Tries | Goals | 1 Point Field Goals | 2 Point Field Goals | Points | Kicking Metres | Try Assists | Linebreaks | Tackle Breaks | Post Contact Metres | Offloads | Receipts | Tackles Made | Missed Tackles | Total Running Metres | Hit Up Running Metres | Kick Return Metres | |
|---|---|---|---|---|---|---|---|---|---|---|---|---|---|---|---|---|---|---|---|---|---|---|
| 2 | Eels | Won | 6 - 32 | Hooker | 58 | - | - | - | - | - | 101 | - | - | 2 | 13 | - | 93 | 23 | 4 | 48 | - | - |
| 3 | Dolphins | Won | 18 - 30 | Hooker | 57 | 1 | - | - | - | 4 | - | 1 | 1 | 3 | 14 | 1 | 98 | 33 | 2 | 49 | 6 | - |
| 4 | Warriors | Lost | 24 - 26 | Hooker | 62 | - | 3 | - | - | 6 | 142 | - | - | - | 13 | 1 | 98 | 39 | 6 | 37 | 15 | - |
| 5 | Broncos | Lost | 46 - 24 | Hooker | 57 | - | 2 | - | - | 4 | - | - | - | 1 | 15 | - | 81 | 15 | 5 | 78 | 31 | - |
| 6 | Knights | Won | 4 - 20 | Hooker | 57 | - | - | - | - | - | - | - | - | 1 | 18 | - | 105 | 31 | 3 | 58 | 11 | - |
Career By Season
| Year | Played | Won | Lost | Drawn | Win % | Tries | Goals | 1 Point Field Goals | 2 Point Field Goals | Points | Kicking Metres | Kicking Metres Average | Goal Conversion Rate | Forced Drop Outs | Try Assists | Offloads | Receipts | Tackles Made | Missed Tackles | Tackle Efficiency | Total Running Metres | Average Running Metres | Kick Return Metres | Total Points | Average Points | |
|---|---|---|---|---|---|---|---|---|---|---|---|---|---|---|---|---|---|---|---|---|---|---|---|---|---|---|
| Rabbitohs | 2014 | 14 | 9 | 5 | - | 64% | 1 | - | - | - | 4 | 52 | 3.68 | - | - | 2 | 2 | 716 | 352 | 14 | 93.61% | 654 | 46.00 | - | 452 | 32.3 |
| Panthers | 2015 | 16 | 7 | 9 | - | 44% | 1 | 4 | - | - | 12 | 398 | 24.84 | 57.14% | 2 | 5 | 14 | 1,095 | 564 | 51 | 91.71% | 740 | 46.00 | - | 692 | 43.2 |
| Sea Eagles | 2016 | 18 | 6 | 12 | - | 33% | 3 | 1 | - | - | 14 | 932 | 51.79 | 25.00% | 6 | 5 | 4 | 1,482 | 580 | 70 | 84.71% | 978 | 54.00 | 35 | 702 | 39.0 |
| Sea Eagles | 2017 | 24 | 14 | 10 | - | 58% | 3 | 1 | - | - | 14 | 137 | 5.70 | 33.33% | - | 6 | 6 | 2,227 | 952 | 123 | 88.56% | 1,430 | 59.00 | 2 | 1,012 | 42.2 |
| Sea Eagles | 2018 | 13 | 4 | 9 | - | 31% | 3 | - | - | - | 12 | 134 | 10.27 | - | 1 | 6 | 3 | 1,140 | 529 | 52 | 91.05% | 606 | 46.00 | 7 | 622 | 47.8 |
| Sea Eagles | 2019 | 22 | 12 | 10 | - | 55% | 2 | - | - | - | 8 | 296 | 13.45 | - | 2 | 1 | 3 | 1,281 | 631 | 44 | 93.48% | 866 | 39.00 | 4 | 703 | 32.0 |
| Panthers | 2020 | 20 | 17 | 2 | 1 | 85% | 3 | - | - | - | 12 | 143 | 7.14 | - | 2 | 4 | 3 | 2,516 | 1,010 | 46 | 95.64% | 1,149 | 57.00 | - | 1,183 | 59.2 |
| Panthers | 2021 | 18 | 16 | 2 | - | 89% | 3 | - | - | - | 12 | 52 | 2.87 | - | - | 1 | 2 | 2,024 | 794 | 62 | 92.76% | 903 | 50.00 | - | 880 | 48.9 |
| Panthers | 2022 | 25 | 22 | 3 | - | 88% | 5 | - | - | - | 20 | 406 | 16.25 | - | 6 | 12 | 9 | 2,758 | 1,020 | 99 | 91.15% | 1,122 | 44.00 | 2 | 1,213 | 48.5 |
| Wests Tigers | 2023 | 21 | 4 | 17 | - | 19% | 6 | 18 | - | - | 60 | 1,544 | 73.51 | 85.71% | 3 | 7 | 12 | 2,029 | 719 | 107 | 87.05% | 1,236 | 58.00 | 1 | 931 | 44.3 |
| Wests Tigers | 2024 | 22 | 6 | 16 | - | 27% | 5 | 43 | - | - | 106 | 1,363 | 61.95 | 78.18% | 2 | 9 | 4 | 2,284 | 818 | 124 | 86.84% | 1,205 | 54.00 | 37 | 975 | 44.3 |
| Wests Tigers | 2025 | 5 | 3 | 2 | - | 60% | 1 | 5 | - | - | 14 | 243 | 48.58 | 83.33% | - | 1 | 2 | 475 | 141 | 20 | 87.58% | 271 | 54.00 | - | 197 | 39.4 |
Career Overall
| Year Start | Year End | Played | Won | Lost | Drawn | Win % | Tries | Goals | 1 Point Field Goals | 2 Point Field Goals | Points | Kicking Metres | Kicking Metres Average | Goal Conversion Rate | Forced Drop Outs | Try Assists | Offloads | Receipts | Tackles Made | Missed Tackles | Tackle Efficiency | Total Running Metres | Average Running Metres | Kick Return Metres | Total Points | Average Points | |
|---|---|---|---|---|---|---|---|---|---|---|---|---|---|---|---|---|---|---|---|---|---|---|---|---|---|---|---|
| Rabbitohs | 2014 | 2014 | 14 | 9 | 5 | - | 64% | 1 | - | - | - | 4 | 52 | 3.68 | - | - | 2 | 2 | 716 | 352 | 14 | 96.17% | 654 | 46.00 | - | 452 | 32.3 |
| Panthers |
2015
2020 |
2015
2022 |
79 | 62 | 16 | 1 | 78% | 12 | 4 | - | - | 56 | 998 | 12.63 | 57.14% | 10 | 22 | 28 | 8,393 | 3,388 | 258 | 92.92% | 3,916 | 49.00 | 2 | 3,968 | 50.2 |
| Sea Eagles | 2016 | 2019 | 77 | 36 | 41 | - | 47% | 11 | 2 | - | - | 48 | 1,498 | 19.46 | 28.57% | 9 | 18 | 16 | 6,128 | 2,690 | 289 | 90.30% | 3,881 | 50.00 | 49 | 3,037 | 39.4 |
| Wests Tigers | 2023 | 2025 | 48 | 13 | 35 | - | 27% | 12 | 66 | - | - | 180 | 3,150 | 65.61 | 80.49% | 5 | 17 | 18 | 4,788 | 1,678 | 251 | 86.99% | 2,712 | 56.00 | 38 | 2,103 | 43.8 |
Latest
Team Mates

Wests Tigers respect and honour the Traditional Custodians of the land and pay our respects to their Elders past, present and future. We acknowledge the stories, traditions and living cultures of Aboriginal and Torres Strait Islander peoples on the lands we meet, gather and play on.
